Analytics
Sitebase counts the visitors and pageviews of every website you connect. No cookies, no consent banner, nothing stored in your visitors' browsers.
Setting it up
Open a website in the dashboard and click Analytics in the sidebar (the first item under
Features). Before any data arrives the Setup tab shows your tracking snippet — one script tag to
add to every page of your site (in the <head> or before </body>), just like
Plausible or Fathom:
<script async crossorigin="anonymous" src="https://sitebase.dev/embed.js" data-sitebase-site="sb_9956592511db47e1ad398ff1"></script>
The data-sitebase-site key identifies your website. Two shortcuts worth knowing:
- Pages that embed a Sitebase feature already report pageviews. The embed script doubles as the tracker, so a page with a waiting list or testimonials wall on it doesn't need the analytics snippet too.
- Single-page apps work out of the box. Client-side navigations (pushState and back/forward) are counted as pageviews automatically.
Visit your site after installing and the first numbers appear within seconds.
What you see
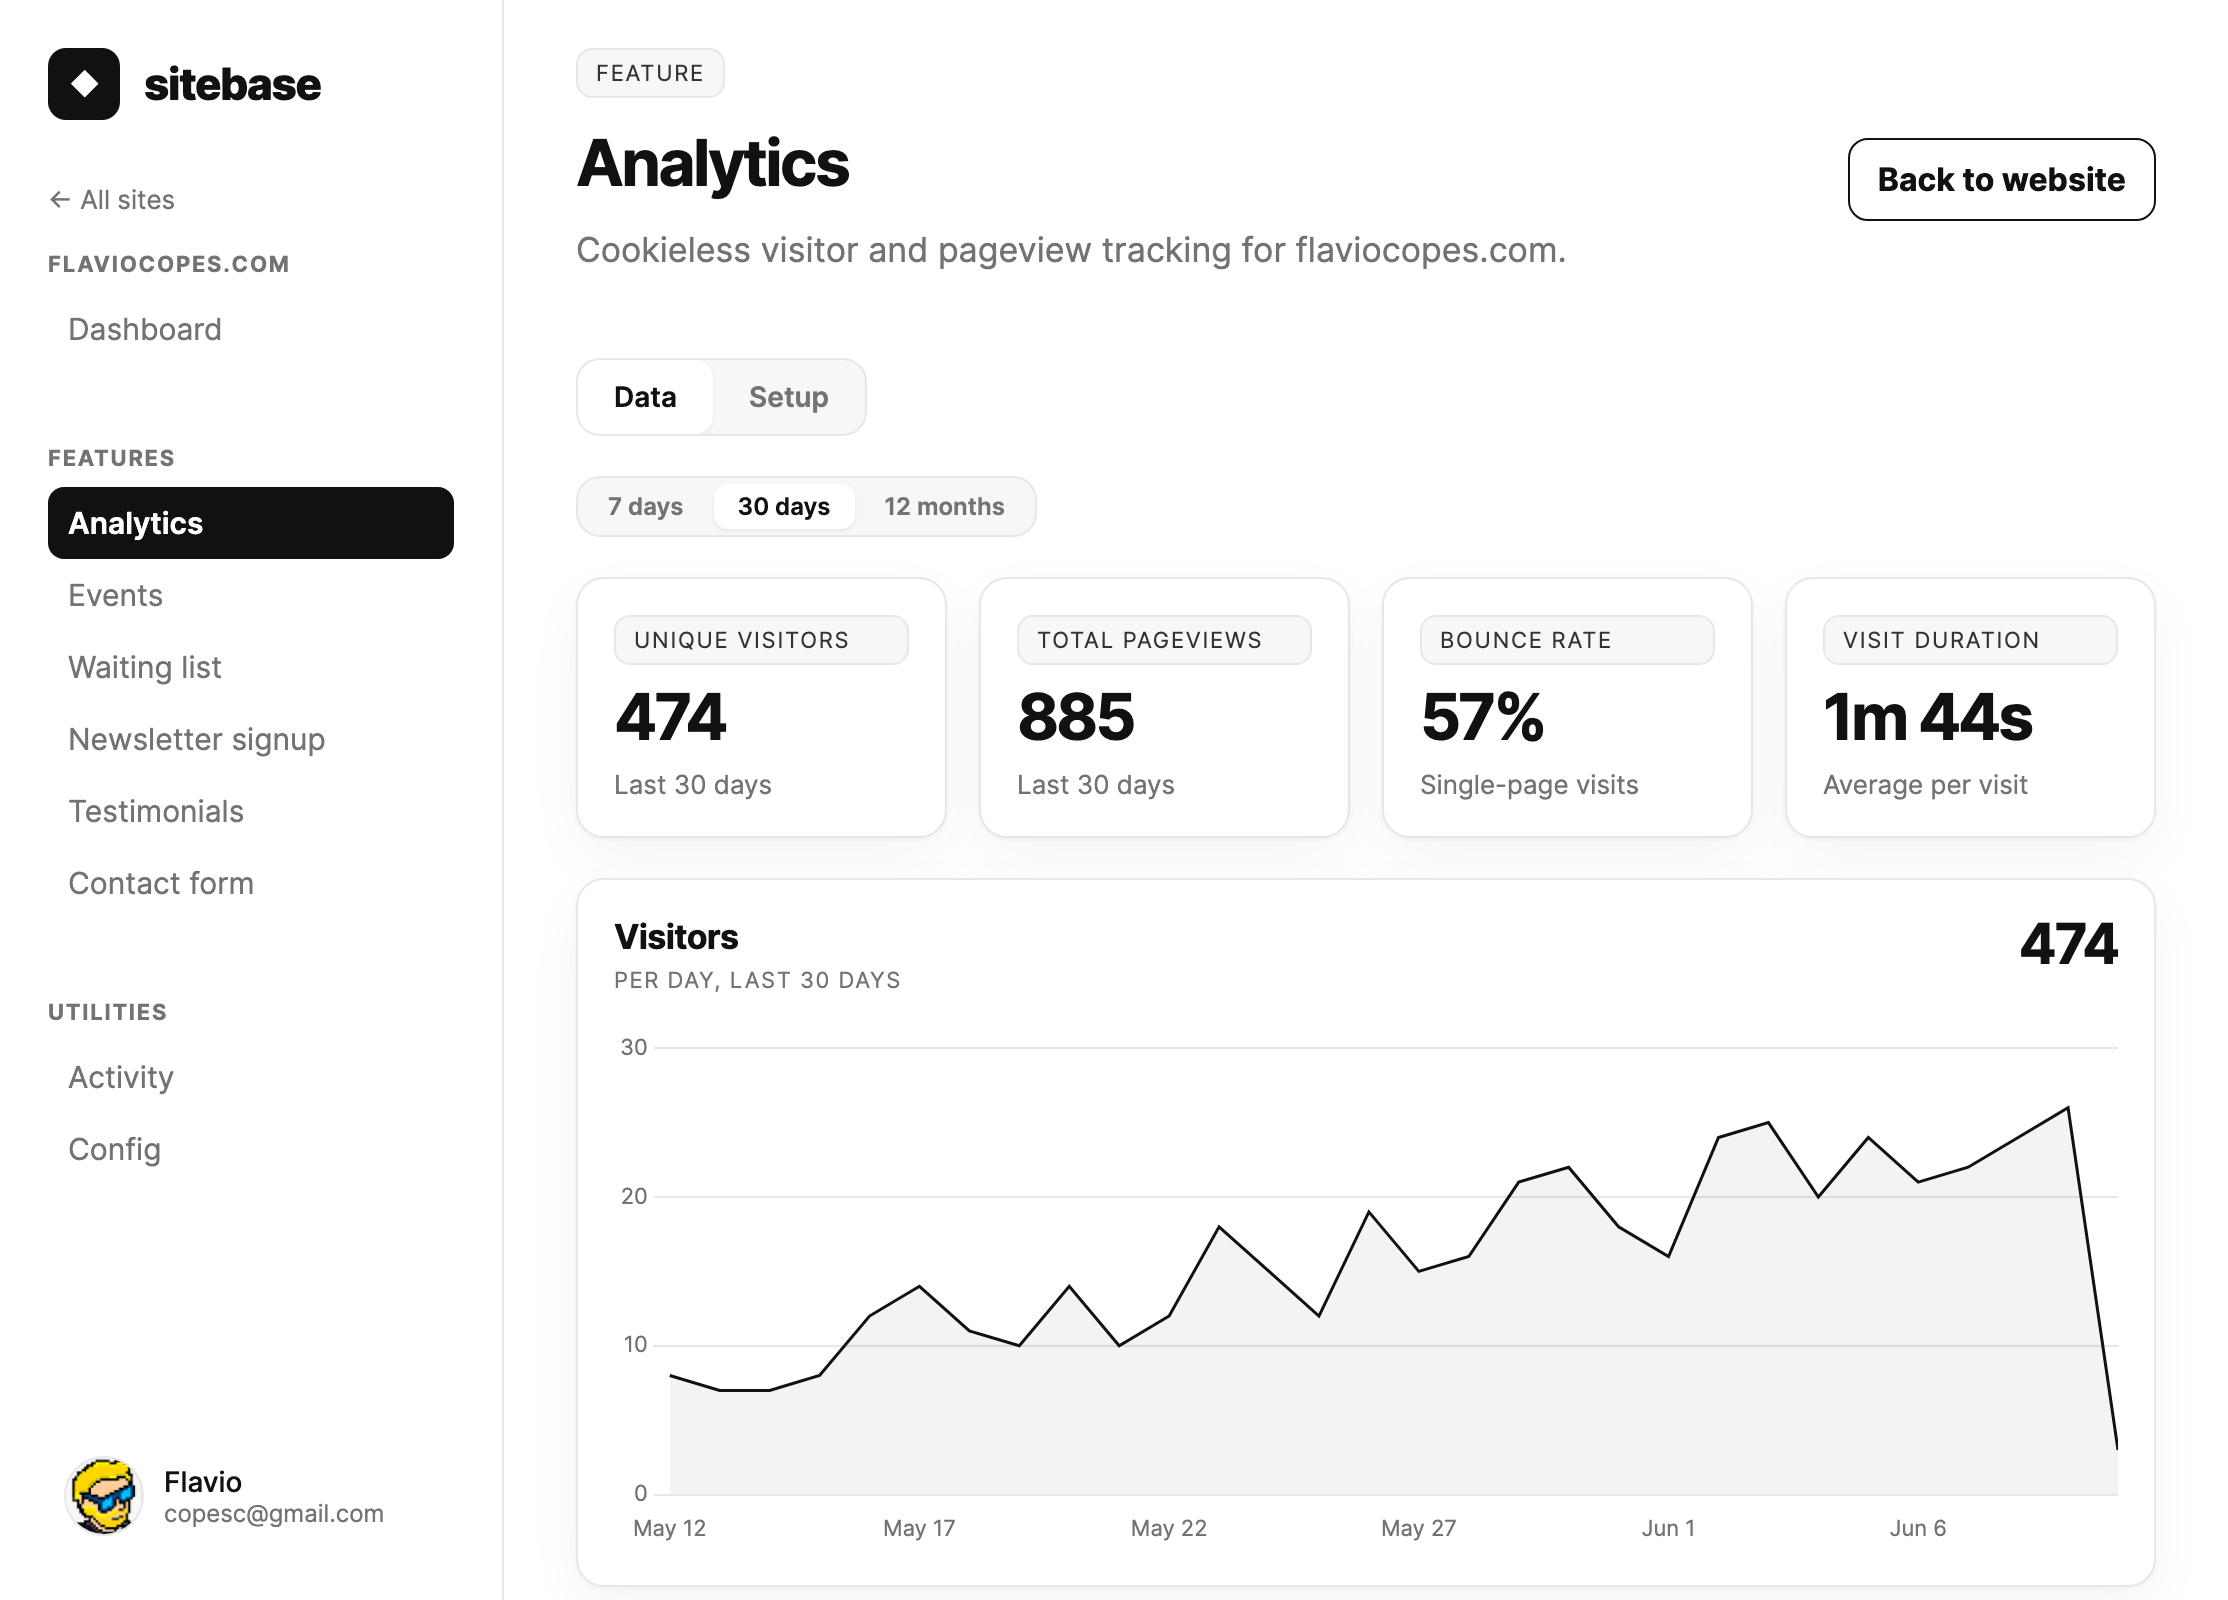
Once pageviews arrive, the Data tab opens with the full report. The website Dashboard view (and the overview homepage) still shows the headline: unique visitors and pageviews over the last 30 days, with a visitors-per-day chart. The Analytics feature is the full report, switchable between the last 7 days, the last 30 days, and a 12-month view:
- Unique visitors, pageviews, bounce rate, visit duration — the headline metrics.
- Visitors over time — a per-day chart for the selected range.
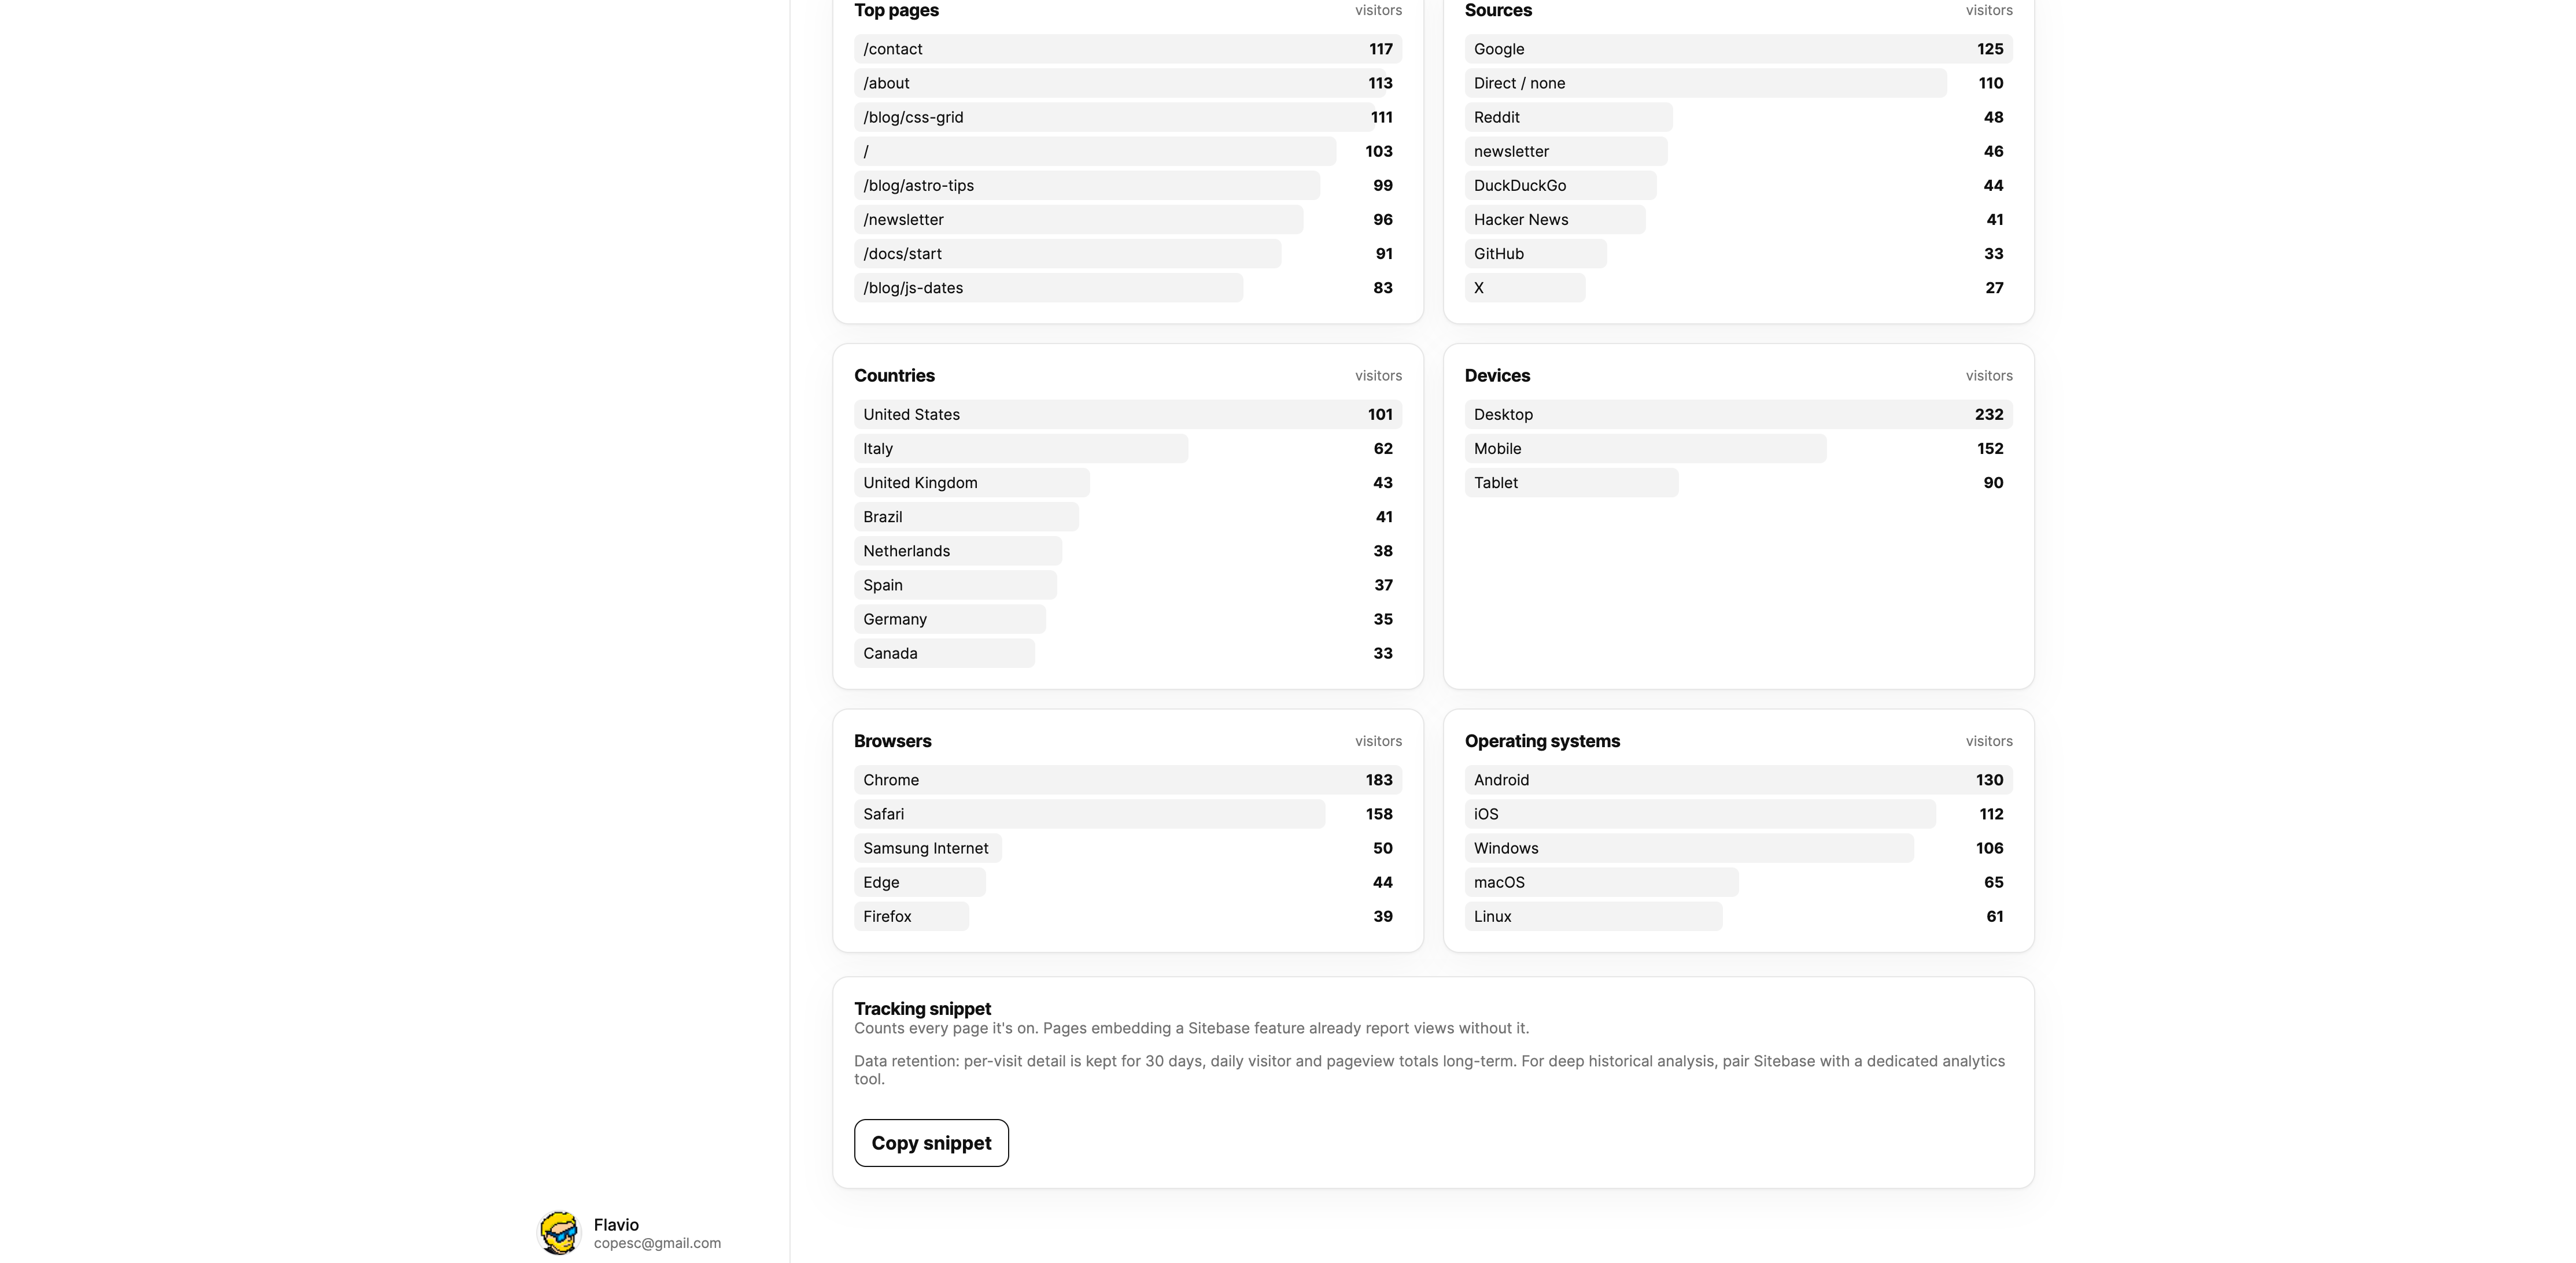
- Top pages — which pages people actually visit.
- Sources — where visits come from: search engines and social networks get friendly names
(Google, X, Hacker News…), and links tagged with
utm_source,sourceorrefquery parameters are attributed to that tag. - Countries, devices, browsers, operating systems — who your visitors are.
Data retention
Sitebase keeps analytics at two levels of detail:
- Per-visit detail for 6 months. Everything the breakdowns are built from — pages, sources, countries, devices, browsers, operating systems — is kept for 6 months on every plan, then deleted.
- Daily totals depend on your plan. Visitors, pageviews, visits, bounce rate and visit duration are summarized per day. Starter keeps 6 months of daily totals (the analytics range picker tops out at "6 months"). Pro, Business, and Agency keep daily totals indefinitely.
This keeps the analytics fast and is a deliberate privacy choice: visitor-level data doesn't pile up forever. The same detail window powers Events and Funnels. Retention applies only to time-series data — user-submitted content like subscribers, form submissions, and testimonials is kept forever on every plan.
How visitors are counted, and privacy
The design follows Plausible Analytics, the reference for privacy-first web analytics. The tracker stores nothing in the browser — no cookies, no localStorage, no fingerprinting. Each pageview is attributed to a visitor by hashing the visitor's IP address and browser together with a random salt that changes every day and is then deleted: the same person counts once per day, the raw IP is never stored, and yesterday's hashes can never be linked back to anyone.
A visit (or session) groups pageviews from one visitor with less than 30 minutes of inactivity between them. A visit that sees a single page counts as a bounce. Known bots and crawlers are filtered out before anything is stored.
To exclude your own visits while you work on your site, run
localStorage.sitebase_ignore = "true" in your browser's console on your site — that browser stops
being counted.
The Analytics page also has a Docs tab with this reference built in: the snippet attributes, SPA tracking behavior, bot filtering, and the opt-out above, right where you set things up.
Next: Events